How to Run Clarity Data Analysis Reports
Looker is a cloud-based business intelligence platform used to create data analytics, visualizations, and dashboards. It is the reporting interface connected to Clarity. Looker allows end users with designated permissions to create customized reports to review data within an instance of Clarity. Looker is available in both the live and training Clarity instances for SLO.
These next steps walkthrough how to access Looker within Clarity. This is also known as Embedded Looker.
How to Access Embedded Looker
· Login to Clarity.
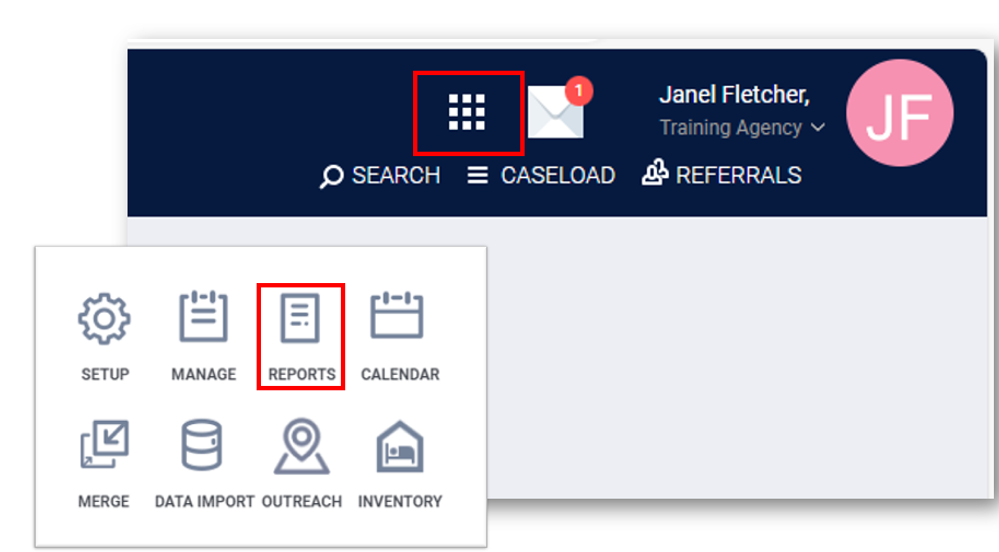
· Select the Launcher Menu (9 Squares) in the top-right corner of the screen.
· Next, click on the Reports icon.

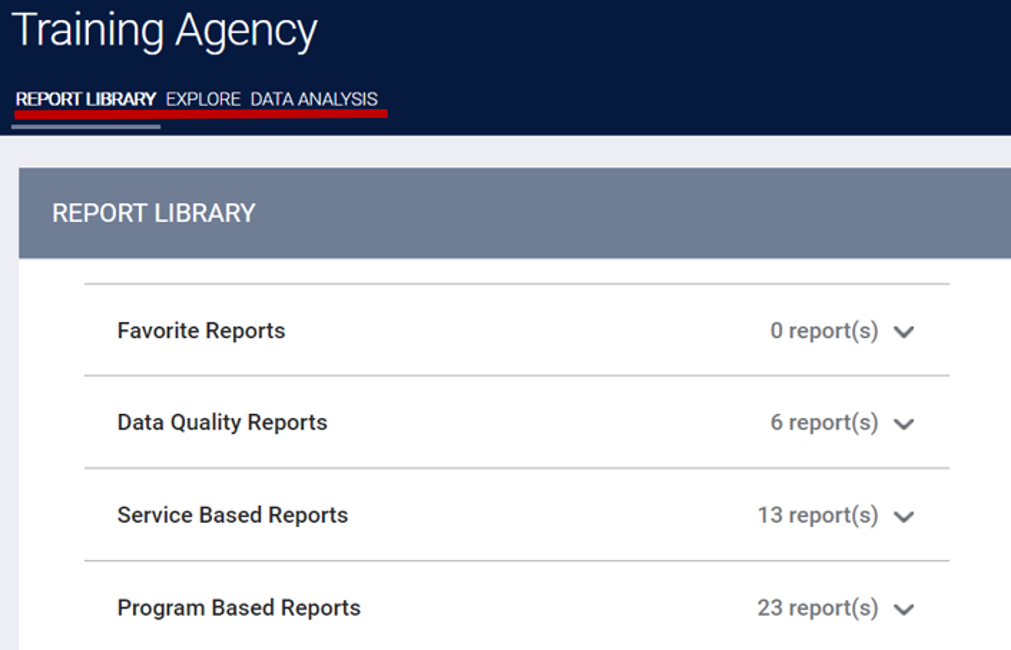
The Report Library will appear, along with options to select Explore or Data Analysis.

On the same page as the Report Library are the Explore and Data Analysis options to access embedded Looker.
Explore is the how to create reports in Looker, and Data Analysis is where Looker reports appear once saved.
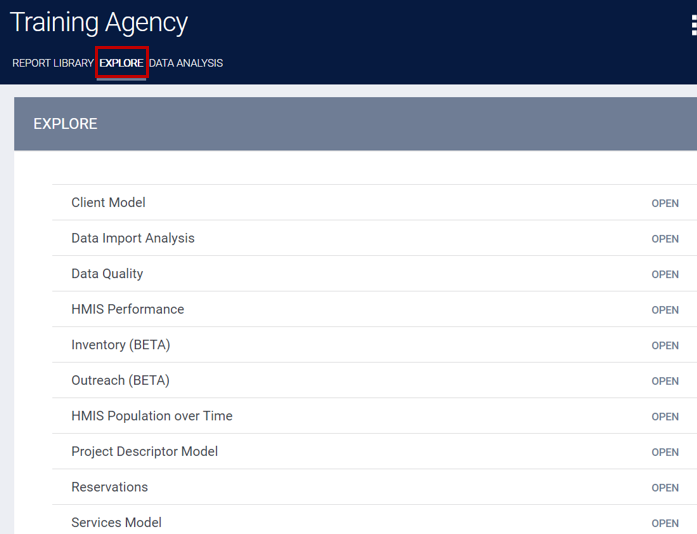
The Explore page has several data tables or Models available to create a report.
· Select Explore to view the Models and begin a report

Data Models
Below are the most frequently used models to review client, services, and program setup data. The screenshot has a list of available Explore Models. Below we will describe the models used most frequently by program administrators.
HMIS Performance Model- Most popular model. Only includes data associated with an enrollment.
Client Model- Includes all client records in a Clarity instance regardless if the client was ever enrolled in a program. Also, the only model to include deleted data.
Services Model- A service must be recorded for client data to appear in the report.
Project Descriptor Model- Includes information about project and agency set-up. Does not contain any client data.
HMIS Population over Time Model- Designed for longitudinal analysis of client data. An enrollment is required for the client to be included.
Data Quality Model- Includes all of the universal data elements (UDEs) and Project Descriptor Data Elements (PDDEs) tracked by an HMIS.
Explore Parameters
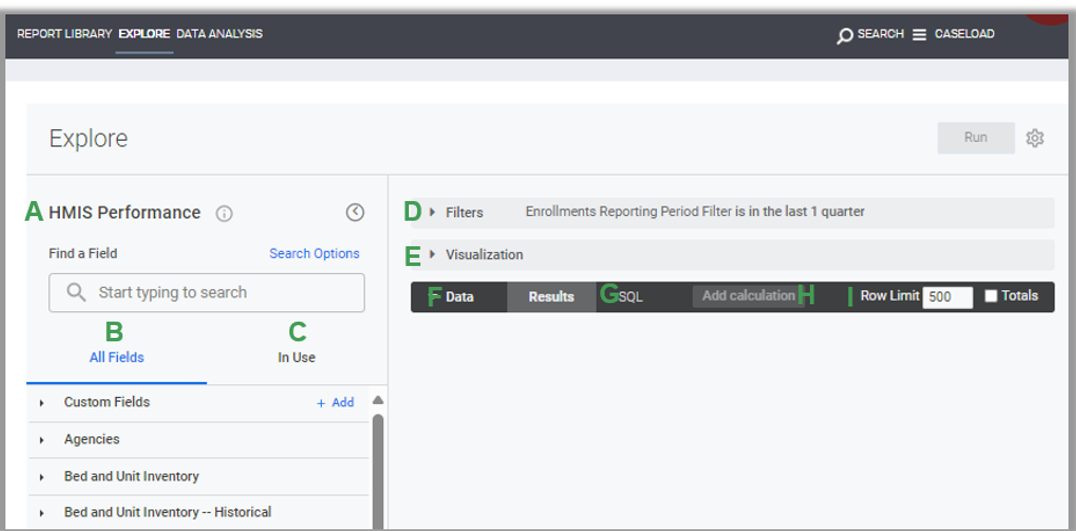
Once a data model is selected, the report layout will appear as shown below.

Data Model (A) – The data model selected from the Explore page will appear here. In this image, the model selected is the HMIS Performance model.
All Fields (B) - Choose the dimensions and measures to be included in the report.
In Use (C) - Will populate to include the measures and dimensions selected in the report.
Filters (D) - There is a default Reporting Period Filter to identify the timeframe for the data intended to appear in the report. Other filters as selected from All Fields will also appear here.
Visualization (E) - Any charts or graphs
Data (F) - Tabular format of data identified based on the selection of fields. Column headers will appear as fields are selected. Data will appear in the columns after the report is Run (top right corner).
SQL (G) - shows how the data was queried (cannot be edited). Can be helpful to provide to Bitfocus Support if you have a question about your report.
Add Calculation (H) – Gives the options for the user to create table calculations (advanced filters) in Looker.
Row Limit (I) – The max number of rows to return in a query. The Row limit for the HMIS Performance Model is 5000. Row limits vary per model.
.png)